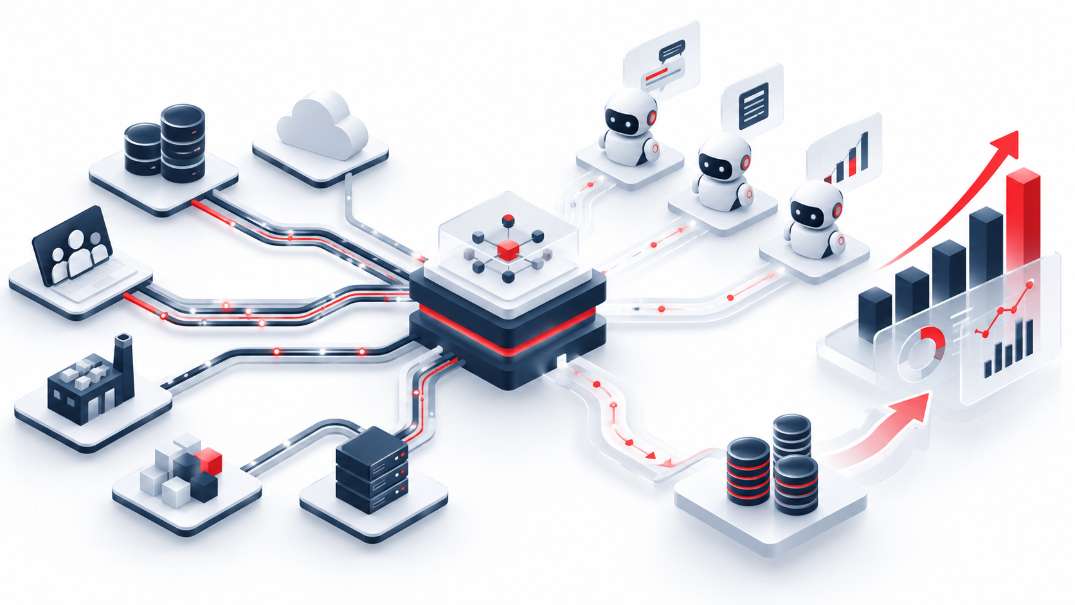
AI interoperability ROI measures the financial return on investing in the layer that enables artificial intelligence systems to access, exchange and use enterprise data and capabilities in a reusable, governed way.
To calculate it properly, you need to compare the full TCO of that layer with the costs avoided, capacity genuinely freed up, risks reduced and contribution margin brought forward.
Depending on the architecture, this layer may include APIs, events, API Management, identity, observability, Data Provenance, Data Lineage and tools-access mechanisms such as MCP.
Its value lies in reducing the incremental effort required to connect each new AI use case to ERPs, CRMs, TMSs, WMSs, legacy systems and other enterprise data sources.
In this guide, we will cover:
- how to build a vendor-neutral business case for AI-focused interoperability,
- how to translate engineering metrics into P&L impact,
- what to include in TCO,
- how to calculate ROI, NPV and payback,
- and how to fund the programme against verifiable milestones so its returns remain defensible even if the platform or partner changes.
Why calculate AI interoperability ROI separately?
Because the ROI of an AI use case and the ROI of the infrastructure that lets multiple use cases reuse the same capabilities are not the same thing.
Consider a logistics company with its own ERP, legacy TMS and WMS platforms, and years of point-to-point integrations. The CIO proposes modernising the interoperability layer before scaling AI copilots and agents.
The CFO has a reasonable objection: “Why invest in integration first when AI is what creates the value?”
But the financial question should be reframed: “What does it cost to keep connecting every new AI use case individually, and what financial value could we unlock by building reusable capabilities?” The maths is straightforward: connecting n systems point to point can require up to n(n−1)/2 links; with a shared layer, it takes n.
According to the 2026 Connectivity Benchmark, based on 1,050 IT leaders at companies with at least 1,000 employees:
- 96% say agent success depends on seamless integration between systems; and
- 94% believe a more API-led architecture is necessary.
The same study puts the average number of enterprise applications at 957, with only 27% integrated.
That does not mean every AI experiment needs a major modernisation effort first. A standalone pilot can work with a limited collection of documents or data.
The requirements change when AI needs to go into production, interact with systems of record, combine data from different domains or execute business actions.
At that point, interoperability, identity, governance and observability become part of the use case’s cost and risk profile.
Gartner offers another relevant warning: it predicts that, through 2026, organisations will abandon 60% of AI projects that are not backed by AI-ready data.
And more than 40% of agentic AI projects could be cancelled by the end of 2027 because of rising costs, unclear business value or inadequate risk controls.
The interoperability business case should therefore not claim that the infrastructure “creates AI”. It should show which recurring costs, delays and risks each subsequent use case can avoid because of it.
Read our latest article: Agentic Enterprise Architecture: how to govern autonomous integrations without restricting autonomy
How do you build the business case and calculate ROI for an AI interoperability layer?
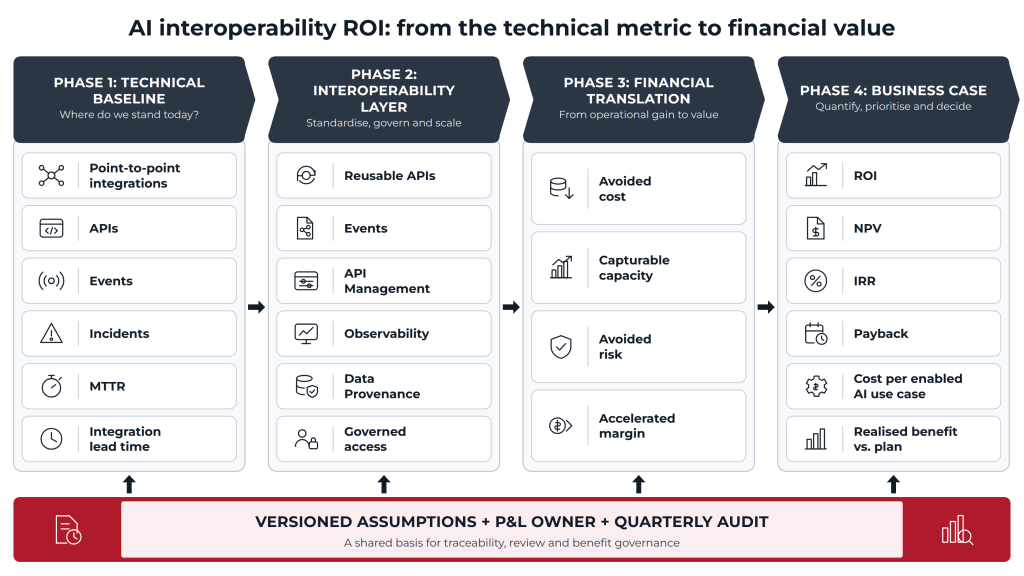
The most defensible approach is to treat interoperability as an investment in its own right and model its incremental cash flows.
The model can be organised into five value categories:
| Value category | What is monetised | Starting technical metric | Owner |
| Avoided costs | Development and maintenance work that no longer needs to be repeated | API/event reuse, decommissioned connectors, duplicate integrations | CIO / CTO |
| Capturable capacity | Resources that can be reassigned or spending that genuinely disappears | Development and maintenance hours freed up | CIO / Engineering |
| Avoided risk | Reduction in expected loss | Incidents, failures, downtime, MTTR | CIO / CRO / CFO |
| Accelerated margin | Value gained by bringing AI use cases forward | Shorter integration time and time to production | COO / Business |
| Strategic capability | Future options made possible | New accessible domains, reuse, interoperability | Executive Committee |
Strategic capability has real value, but it should only enter the financial model when it can be linked to a specific cash flow. Until then, keep it as a qualitative benefit to avoid artificially inflating returns. It can be valued as a real option when a concrete future decision exists.
Turning engineering metrics into financial value
A CFO will not approve a proposal because “We will increase API reuse to 50%.”
They will approve it because “Every reused asset avoids the cost of building and maintaining another integration, based on costs measured in our baseline.”
Here is how to make that translation:
| Engineering metric | Financial metric | Calculation |
| API/event reuse | Avoided development cost | Assets that do not need to be rebuilt × actual development cost per asset |
| Legacy connector retirement | Avoided maintenance cost | Connectors retired × associated actual annual cost |
| Reduced manual effort | Capturable capacity | Hours genuinely freed up × hourly cost × capture factor |
| Lower MTTR | Avoided downtime cost | Downtime hours avoided × financial impact per hour |
| Fewer incidents | Avoided expected loss | Baseline frequency × impact × attributable reduction |
| Shorter integration time | Accelerated margin | Monthly contribution margin × months brought forward × attribution factor |
| Greater reuse | Lower marginal cost of the next use case | Baseline cost per integration − cost using existing assets |
The key word is actual.
A generic assumption of €12,000, €18,000 or €24,000 per connector is not defensible.
The organisation needs to establish what it currently spends on maintenance, support, fixes, infrastructure, licensing, internal development and external suppliers. That is the baseline.
How much of the time saved can actually be counted as a benefit?
Not every hour saved translates into a financial benefit.
Suppose a reusable architecture frees up 5,000 development hours a year.
Simply multiplying: 5,000 × cost/hour
and presenting the result as savings can be misleading if payroll remains unchanged and the team simply has more time available.
It is important to distinguish between:
- cashable savings, where a cost genuinely disappears: less outsourced work, less overtime, avoiding a future hire or ending a contract;
- released capacity, where the same people can deliver more work.
The second has value, but it must be tied to a measurable outcome before it can be included as a financial benefit.
The formula is:
CAPTURABLE_CAPACITY =
hours_freed
× fully_loaded_hourly_cost
× capture_factor
The capture factor should be an editable assumption approved by the P&L owner. It can be derived from historical results: what share of hours freed up by earlier programmes translated into lower spending or measurable additional output?
No 30%, 50% or 80% figure can be treated as a universal benchmark.
Even Forrester, in its MuleSoft TEI study, uses an assumption specific to its composite organisation and acknowledges that the ability to recapture that time productively varies between organisations.
Calculating avoided risk without resorting to “creative accounting”
Risk reduction should be quantified using expected loss, not an arbitrary amount. Expected loss does not capture tail risk: for rare, high-impact events, it is worth modelling the distribution (using FAIR) and reporting a high percentile as well.
EXPECTED_LOSS =
annual_incident_frequency
× average_financial_impact
Then:
AVOIDED_RISK =
baseline_expected_loss
− post_intervention_expected_loss
For example, if integration incidents have historically caused downtime, reprocessing or penalties, start with those actual figures.
Incorporar ABAC, mTLS, observabilidad o Adding ABAC, mTLS, observability or API Governance does not automatically reduce incidents by a fixed percentage.
These measures can reduce exposure and improve incident management, but any reduction in the financial model must be validated against the organisation’s history.
The NIST AI RMF provides a framework for continuous governance (Govern, Map, Measure, Manage), but it does not supply a risk-reduction percentage. The organisation is responsible for assigning a financial value.
How to put a value on getting an AI use case into production sooner
Speed only creates financial value if bringing a launch date forward also brings a benefit forward.
That is why simply calculating:
3 AI use cases × annual value
is not enough.
The appropriate formula is:
ACCELERATED_MARGIN =
monthly_contribution_margin
× months_actually_brought_forward
× interoperability_attribution_factor
If a project goes live four months earlier, we cannot automatically attribute the entire acceleration to the interoperability layer.
Other factors may have played a part, including the model, approval process, business availability, UX, data quality or organisational change.
The business case must document what share of that acceleration can reasonably be attributed to reusing existing APIs, contracts, events, data and policies. One defensible approach is a weighted matrix of contributing factors, adding up to 100%, agreed with the owners of each factor.
Read our latest article: Token Economics in AI: from cost per token to real cost per task
TCO must cover far more than the licence
A defensible ROI needs a complete denominator.
The interoperability layer’s TCO should include:
| Cost category | What to include |
| Platform | Integration, API Management, events, observability, identity |
| Implementation | Architecture, configuration, development and testing |
| Migration | Redesign and transfer of existing integrations |
| Legacy retirement | Decommissioning, contracts and dependencies |
| Transition | Coexistence period and parallel operation |
| Data | Catalogue, Data Provenance (data origin), Data Lineage (data journey) and quality |
| Security | Identity, access, audit and controls |
| People | Training, new roles and governance |
| Change | Adoption and process changes |
| Operations | Cloud, support, maintenance and ongoing improvement |
Separate CAPEX from OPEX: some development costs may be capitalised as intangible assets (IAS 38), changing the profile of the cash flows without changing the cash outlay. The period of parallel running should not be set in advance.
It should be modelled as its own variable:
TRANSITION_COST =
months_of_parallel_running
× monthly_legacy_environment_cost
+
monthly_new_environment_cost
+
additional_operating_costs
That allows the CFO to adjust the assumption during a meeting and immediately see its impact.
Formulas for calculating ROI, NPV and payback
Once benefits and TCO have been defined, the model can use standard formulas. Before applying them, the four benefit categories must be mutually exclusive: avoided costs are external expenses eliminated; capturable capacity covers internal hours not already counted; avoided risk measures business impact rather than repair costs; and accelerated margin is counted only once, in the year when the use case is brought forward.
Annual benefit
BENEFIT_t =
avoided_cost_t
+ capturable_capacity_t
+ avoided_risk_t
+ accelerated_margin_t
Three-year ROI
ROI_3_YEARS =
[ Σ benefits_t
− initial_investment
− Σ operating_and_transition_costs_t ]
/
[ initial_investment
+ Σ operating_and_transition_costs_t ]
× 100
Operating costs must not be counted twice. Three years is also a committee reporting convention, not the asset’s useful life: the layer typically lasts five to seven years, so it is worth presenting a five-year calculation as well.
Net Present Value
NPV =
− initial_investment
+ Σ [(benefits_t − costs_t) / (1 + r)^t]
The discount rate r is not just another model assumption.
It must be the discount rate approved by Finance, usually aligned with WACC, the hurdle rate or the company’s investment criteria, and consistent with the cash flows: nominal rates for nominal flows, real rates for constant-price flows.
Payback
Payback is reached when:
cumulative_cash_flow ≥ 0
It is worth distinguishing simple payback from discounted payback (based on cash flows discounted at r), and reporting IRR alongside them: the rate at which NPV = 0, which can be compared with the hurdle rate. There is no universally “typical 18–36 month payback”.
Forrester’s TEI studies report:
- 426% ROI for its MuleSoft composite organisation; and
- 347% for its Boomi composite organisation,
both with payback of less than six months.
Both studies were commissioned by the vendors and use composite organisations and their own assumptions.
They show that returns can be quantified, not that those figures can be applied to another organisation.
Illustrative example: AI interoperability ROI
Let us assume:
| Variable | Illustrative assumption |
| Initial investment | €1,200,000 |
| Annual operating cost | €250,000 |
| Steady-state annual gross benefit | €1,256,000 |
| Year 1 benefit capture | 40% |
| Year 2 capture | 80% |
| Year 3 capture | 100% |
The gross benefits would be:
Year 1: €502,400
Year 2: €1,004,800
Year 3: €1,256,000
Total benefits = €2,763,200
The total cost is:
€1,200,000
+ (€250,000 × 3)
= €1,950,000
Therefore:
ROI =
(2,763,200 − 1,950,000)
/
1,950,000
= 41.7%
That three-year ROI of 41.7% is equivalent to an annualised 12.3%, with an IRR of 25.0%. Assuming benefits accrue evenly throughout each year, simple payback occurs in month 26.3 and discounted payback at 9% in month 29.1.
NPV at 9% would be €443,676, although Finance must determine the discount rate.
The example does not prove that an interoperability layer will deliver a 41.7% return. It demonstrates how the calculation should be built and audited.
How to build conservative, realistic and optimistic scenarios
The formulas remain the same across scenarios. Only the assumptions change:
| Variable | Conservative | Realistic | Optimistic |
| Integration retirement | Low | Approved baseline | High |
| Capture of hours freed up | Low | Expected | High |
| Incident reduction | Limited | Baseline | Significant |
| AI use cases accelerated | Few | Planned | More use cases |
| Months brought forward | Fewer | Expected | More |
| Transition costs | High | Budgeted | Low |
| Adoption | Slow | As planned | Fast |
The conservative scenario should still be financially defensible. It is also worth running a tornado sensitivity analysis on the three or four variables with the greatest impact on NPV.
If the programme only works under the optimistic scenario, the business case is not ready for the investment committee.
What is a Minimum Viable Interoperability Layer?
You do not need to modernise the entire technology landscape before generating value.
A Minimum Viable Interoperability Layer (MVIL)—a term used here, not an industry standard—is the smallest shared capability needed to support the first priority use cases while maintaining reuse and governance.
Initially, it can focus on: the required systems of record + essential APIs/events + identity + observability + data contracts + minimum governance.
Si los agentes utilizan herramientas mediante If agents use tools through Model Context Protocol (MCP), those servers can be added as another way to expose capabilities.
MCP does not replace the enterprise interoperability model. You still need to know which systems, identities, data and policies sit behind it.
The goal is to avoid two extremes:
- building every AI use case from scratch;
- trying to modernise the entire enterprise estate before delivering any results.
Fund milestones, not promises
Funding for a multi-year investment should be released against evidence of value, not technical activity.
Universal thresholds such as 30%, 60% and 100% are not useful. Instead, define decision gates:
| Gate | What it must demonstrate |
| Baseline | Current costs, timelines, incidents and integration map |
| Operational MVIL | First domain connected and first use case running |
| Proven reuse | One asset already serves multiple use cases without being rebuilt |
| Retirement | Legacy cost genuinely eliminated |
| Realised value | Financial benefit validated against the plan |
| Scaling | Funding is released only if previous gates keep the business case viable |
The principle is simple: funding follows proven value, not the percentage of the project completed.
How to keep ROI independent of the vendor or partner
The business case should exist independently of whichever tool is purchased.
To achieve this, four elements must remain owned by the organisation: baseline → financial model → version-controlled assumptions → evidence of realised benefits.
The platform, partner and APIs may change, and event contracts may evolve.
But it must still be possible to reconstruct:
- what investment was approved,
- what benefits were expected,
- who was accountable,
- what actually materialised, and
- why there was a variance.
This matters particularly when assessing vendor-sponsored TEI studies.
In its study, Forrester states that MuleSoft commissioned the research and models a composite organisation based on seven decision-makers from six organisations.
What sets this approach apart is a reproducible financial methodology that does not tie returns to any one technology.
How should benefits be governed after the investment is approved?
ROI should become a programme metric, not something audited just once before the budget is signed off.
Every technical indicator needs a baseline + formula + owner + assumption + evidence source + review frequency.
For example:
| Indicator | Technical owner | Financial owner | Evidence |
| Connectors retired | Architecture | CIO / Finance | CMDB + contracts |
| Development hours | Engineering | CIO | Timesheets / delivery |
| Incidents | Operations | CRO / CFO | ITSM |
| MTTR | Operations | Business | Monitoring |
| Integration time | Architecture | Business | Delivery |
| Accelerated margin | Business | CFO | P&L |
| Cost per AI use case | FinOps | CFO | Ledger / ERP |
A quarterly review can then compare:
PLANNED BENEFIT
vs.
REALISED BENEFIT
and decide whether to continue, adjust or stop the next phase.
Download our ebook: ERP Modernization: Navigating Challenges and Opportunities for business
Responding to the investment committee’s main objections
1. “Why not fund the AI use case directly?”
Because when several use cases need access to the same systems, rebuilding connectors, contracts, identity and controls for every project increases the marginal cost.
Interoperability should only be funded to the point where that reuse can be demonstrated.
2. “A vendor claims its platform delivers more than 300% ROI. Why do we need another calculation?”
Because those TEI studies are useful methodological references, but they rely on a specific platform and composite organisation.
The committee needs the ROI for the company’s actual technology landscape, costs, TCO and ability to capture the benefits. A useful headline metric is cost per AI use case enabled (period TCO / use cases in production); the break-even point is N = investment / (point-to-point cost per use case − marginal cost with the layer).
3. “The hours saved do not reduce my P&L.”
Correct. They should not all be counted as savings.
Only the share that eliminates expenditure, avoids new hires or produces demonstrably valuable additional output can be monetised.
4. “Why do this now?”
Because agents increase the number of systems and capabilities an AI initiative may need.
Salesforce’s 2026 Connectivity Benchmark found an average of 957 applications, only 27% of which are integrated, and 86% of leaders concerned that without proper integration, agents could create more complexity than value.
A defensible ROI starts before you choose a platform
The purpose of an AI interoperability ROI business case is to establish whether that return actually exists for the organisation concerned.
That means:
- measuring the current architecture before replacing it,
- separating cashable benefits from theoretical capacity,
- including the full TCO,
- testing different scenarios, and
- assigning every assumption to someone who can stand behind it.
At Chakray, we take a vendor-neutral approach to this analysis, connecting architecture, APIs, legacy systems and observability with financial metrics that help organisations decide what to modernise, in what order and how far to go.
You may also be interested in: API wrappers in legacy systems for licensing cost control
Frequently asked questions about AI interoperability ROI
What is AI interoperability ROI?
It is the financial return attributable to the integration layer that enables governed reuse of data, APIs, events and enterprise capabilities across different AI use cases.
It is calculated by comparing its incremental benefits with the full TCO of implementing and operating it.
How do you calculate ROI for an interoperability layer?
Add together avoided costs, financially capturable capacity, avoided risk and incremental margin, and compare them with investment, migration, transition and operating costs.
Assumptions must come from the organisation’s own baseline, not generic benchmarks.
What is the typical payback period for an interoperability investment?
There is no universally defensible timeframe. Payback depends on the technology landscape, TCO, reuse, actual elimination of legacy costs and the value of the use cases enabled.
Vendor studies can provide a useful reference but should not be carried directly into the business case.
How can you avoid inflating ROI through productivity assumptions?
Do not automatically count every hour saved as a financial benefit.
Only monetise saved hours when they eliminate spending, avoid hiring or create additional capacity linked to a measurable financial outcome.
How can you avoid vendor lock-in in the business case?
Keep the baseline, formulas, assumptions, owners and evidence of benefits outside the platform.
The financial model should still be recalculable if the technology vendor, systems integrator or architecture changes.
Must all integrations be modernised before deploying AI?
No. Standalone pilots can work without a broad transformation.
For production use cases that access multiple systems, a Minimum Viable Interoperability Layer allows organisations to build only the shared capabilities they need, then expand them once the value has been demonstrated.